

Ⅰ. Introduction
Ⅱ. Methodology and Data
Ⅲ. Results
1. Unit root test
2. ARDL Bounds test
3. Short run dynamics
4. Long- run equilibrium
5. Model stability
Ⅳ. Conclusions
Ⅰ. Introduction
Since the Paris Agreement of the UNFCCC, both developed and developing countries have been working to reduce greenhouse gas emissions. Almost all countries submitted their Nationally Determined Contributions for the 2030 mid-term targets to the UNFCCC and have set carbon neutrality goals for 2050. While some countries have postponed their carbon neutrality target year to after 2050, most countries have set 2050 as their carbon neutrality target year. Over the past 30 years, the energy mix of countries worldwide has also undergone significant changes. In particular, the proportion of renewable energy sources including solar, wind, geothermal, and bioenergy has risen, whereas the reliance on oil, coal, and natural gas has declined. According to the IEA’s 2023 Primary Energy Supply of the World, the share of renewable energy, including hydropower, has increased from 6.7% in 1990 and 7.1% in 2000 to 14.5% in 2023. Excluding hydropower, renewable energy increased from 36.5 million tons in 1990 and 68.7 million tons in 2000 to 1,208.1 million tons in 2023.
This diversification of energy supply is believed to have had an impact on economic growth. Many studies have already explored the relationship between energy consumption and economic growth. (Kraft and Kraft, 1978; Stern, 2000; Lee, 2005; Apergis and Payne, 2009; Ozturk, 2010; Payne, 2010, etc.). Regarding South Korea, Kim and Hong (2022) examined the causal relationships among energy consumption, economic growth, and energy prices employing both the Vector Error Correction Model (VECM) and the Autoregressive Distributed Lag (ARDL), and conducted a comparative analysis for the models’ forecasting performance.
Recently, with the growing adoption of renewable energy has led to a substantial increase in research investigating causal relationship between renewable energy use and economic growth. Some of the key studies in this area are presented in <Table 1>. Panel analyses targeting multiple countries include studies by Apergis and Payne (2010a, 2010b, 2012), Ntanos et al. (2018), Yang et al. (2022), Hwang (2023), Jiang et al. (2023), and Wang et al. (2023). Apergis and Payne (2010a, 2010b, 2012) investigated the nexus between renewable energy consumption and economic growth in 13 Eurasian countries, 20 OECD countries, and 80 countries, respectively. They found bi-directional causal relationship between renewable energy and economic growth in the short as well as the long run across all the countries examined. Furthermore, it was confirmed that renewable energy consumption has a highly significant positive impact on economic growth in the long run. Nantos (2018) investigated this relationship across European countries, providing evidence that renewable energy positively contributed to economic growth. Jiang et al. (2023) analyzed the E-7 countries and confirmed that renewable energy consumption is positively linked with GDP across all quantiles. Yang et al. (2022) analyzed the impact of renewable energy on economic growth in 24 countries with nuclear energy, while Wang et al. (2023) analyzed the Next Eleven countries. Their study also found that renewable energy exerts a positive effect on economic growth. However, Kim and Jeon (2022) analyzed 89 countries worldwide and found that renewable energy exerts a negative effect on economic growth.
Analyses targeting specific countries include those by Lee and Jung (2018), Gyimah et al. (2022), Minh and Van (2023), Saba (2023) and Kim et al. (2024). Lee and Jung (2018) investigated the nexus between renewable energy consumption and economic growth focusing on South Korea and found that renewable energy had a negative impact on economic growth. Gyimah et al. (2022) examined the nexus between renewable energy and economic growth in Ghana and found that renewable energy exerts a negative effect on economic growth. Minh and Van (2023) investigated the linkage between renewable energy and economic growth in Vietnam, whereas Saba (2023) explored this relationship in South Africa. The findings of both studies indicated that renewable energy contributes positively to economic growth. The reason why the effects vary by country appears to be a result of the complex interplay of factors such as the economic situation of the analyzed countries, their stage of economic development, effective greenhouse gas reduction methods, the stage of renewable energy deployment, and the composition of renewable energy sources. Kim et al. (2024) investigated the relationship between China’s economic growth, carbon dioxide emissions, and renewable energy generation from 1980 to 2021. They found that renewable energy causes both economic growth and CO2 emissions.
<Table 1>
The previous studies on the effect of energy sources and economic growth
| Subjects | Regions | Periods | Methods | Variables | Main Results |
| Apergis and Payne (2010a) |
Eurasia 13 countries |
1992- 2007 |
Panel vector error correction model Panel Fully Modified OLS |
GDP, Renewable energy consumption, gross fixed capital formation, Labor force |
Bidirectional causality between renewable energy consumption and economic growth |
| Apergis and Payne (2010b) |
20 OECD countries |
1985- 2005 |
Panel vector error correction model Panel FMOLS |
GDP, Renewable energy consumption, gross fixed capital formation, Labor force |
Bidirectional causality between renewable energy consumption and Economic growth |
| Apergis and Payne (2012) | 80 countries |
1990- 2007 |
Panel vector error correction model Panel FMOLS |
GDP, Renewable energy consumption, gross fixed capital formation, Labor force |
Bidirectional causality between renewable and non-renewable energy consumption and economic growth |
| Minh and Van (2023) | Vietnam |
1995- 2019 |
Autoregressive distributed lag model (ARDL) |
GDP, Renewable energy consumption, Capital, Labor |
Renewable energy use and capital positively impact the GDP in the long term |
| Gyimah et al. (2022) | Ghana |
1990- 2015 |
Granger Causality, Mediation model |
GDP, Renewable energy consumption, Foreign direct investment, Trade, Gross capital formation |
Renewable energy use has a direct negative influence on economic growth. |
| Jiang et al. (2023) | E-7 countries |
1996- 2019 |
Panel quantile regression (PQR) |
GDP, Renewable energy consumption, Trade openness, capital, labor, Economic policy uncertainty, Institutional quality |
Renewable energy consumption is positively linked with GGDP across all quantiles. |
| Kim and Jeon (2022) | 89 countries |
1995- 2018 |
Arellano-Bond GMM methodology |
GDP, Renewable energy,Solar energy, Wind energy, Bio energy consumption etc. |
Renewable energy hassignificant negative effect on economic growth. |
| Lee and Jung (2018) | South Korea |
1990- 2012 |
Autoregressive distributed lag model (ARDL) |
GDP, Renewable energy consumption, Capital, Labor |
Renewable energy consumption has a negative effect on economic growth |
| Saba (2023) | South Africa |
1960- 2019 |
Autoregressive distributed lag model (ARDL) |
GDP, CO2 emissions, Renewable energy consumption, Military expenditure, Trade, Capital, Labor, School enrollment force |
Renewable energy hassignificant positive effect on economic growth. |
| Ntanos et al. (2018) |
European Countries |
2007- 2016 |
Error-corrected log-linear specification models |
GDP, Renewable energy consumption, Nonrenewable energy consumption, Capital, Labor |
Renewable energy has significant positive effect on economic growth. |
| Hwang (2023) |
18 Latin American and caribbean countries |
2003 -2019 |
FixedEffect Panel Threshold Regression (FEPTR) Moments Quantile Regression (MMQR) |
GDP, Renewable energy consumption, Renewable Energy Transition Index (RETI), Digital Economy Index (DEI) are |
Renewable energy transition and the digital economyhave a significant positive impact on economic growth. |
| Wang et al. (2023) |
24 countries with nuclear energy |
2001- 2020 |
Panel fully modified ordinary least squares |
GDP, coal, oil, natural gas,nuclear power,renewable energyconsumption |
Apositive relationship between increased nuclear energy, increased renewable energy, and economic growth. |
| Yang et al. (2022) |
Next eleven countries |
1990- 2020 |
Method of Moments Quantile Regression (MMQR), |
GDP, Renewable energyconsumption, Industry value added, Globalization Index, Final consumption expenditures, Human development index. |
Renewable energy consumption boosts economic growth in short run only |
| Kang (2022) |
OECD countries |
2000- 2019 | OLS, fixed effects |
GDP, CO2 emissions, Renewable energy |
Renewable energy consumption has a negative effect on economic growth |
| Kim et al. (2024) | China |
1980- 2021 |
Vector Autoregression |
GDP, CO2 emissions, Renewable energy |
Renewable energy causes economic growth |
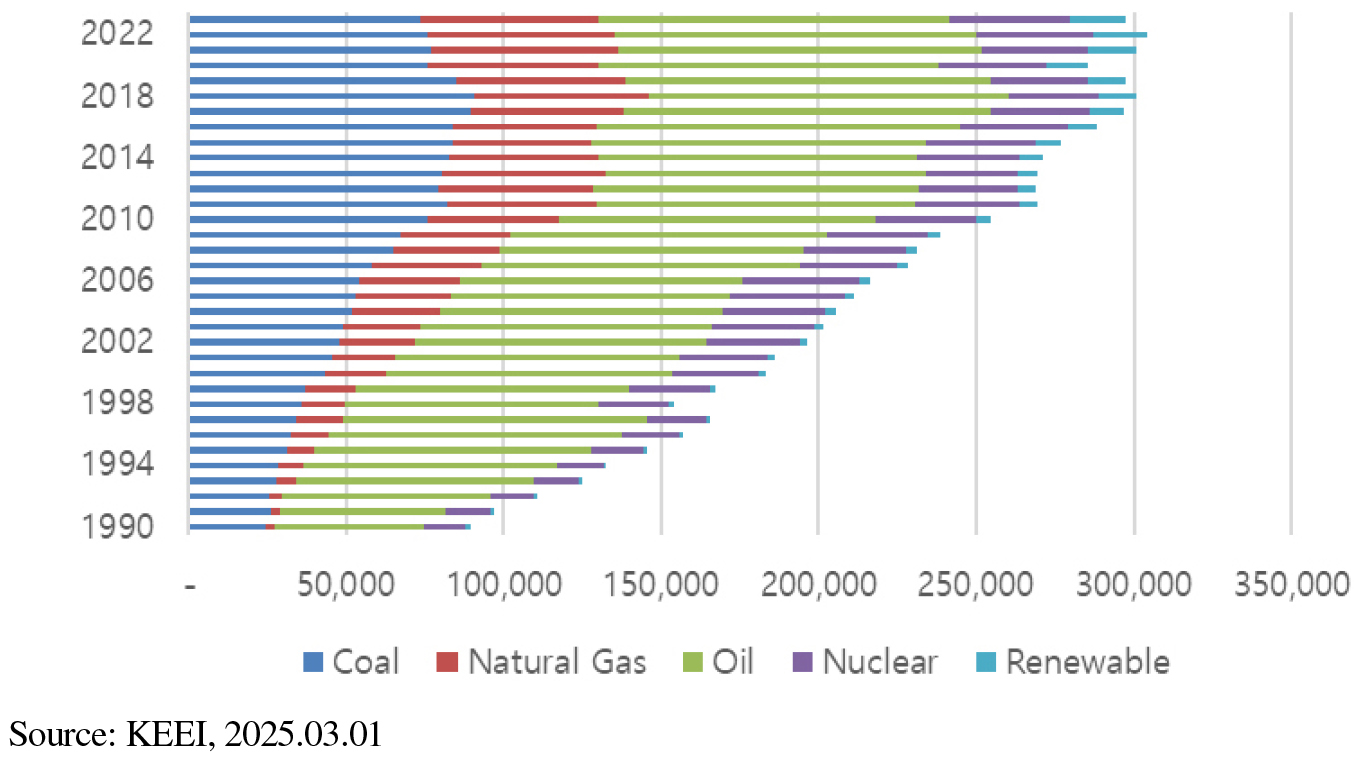
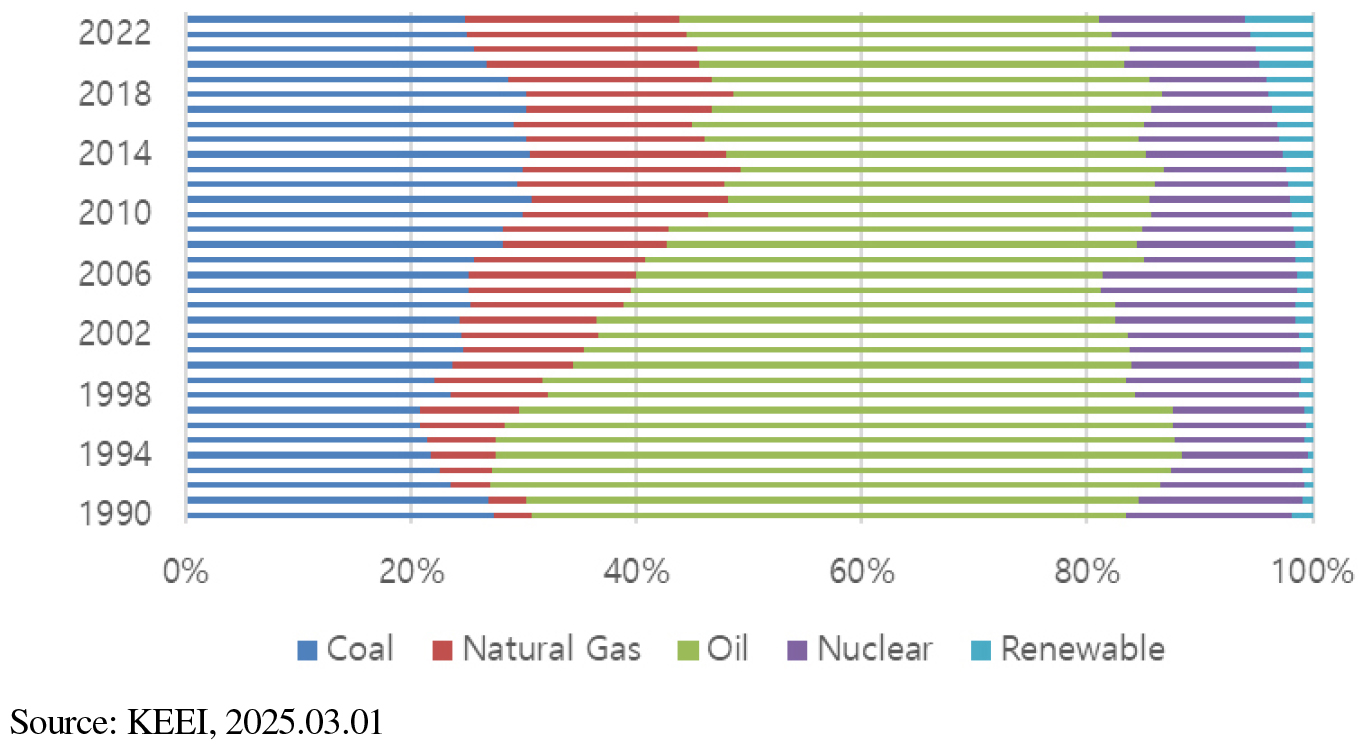
In the case of South Korea, the proportion of renewable energy in primary energy supply increased from 1.77% in 1990 to 5.95% in 2023. However, the rise in South Korea’s renewable energy share began around 2010. As shown in [Figure 1], the consumption of every energy sources, including coal, oil, and natural gas, has increased in primary energy supply. However, there are some differences in their respective proportions. As shown in [Figure 2], the proportion of coal continued to increase until 2018, after which it began to decline. The proportion of oil, its proportion has steadily decreased, although the rate of decline has slowed since 2010. The proportion of gas, on the other hand, has increased rapidly. The proportion of nuclear energy increased in the 1990s but has decreased since then. The proportion has remained relatively stable at around 10% to 15%, and was at 13% in 2023. Renewable energy still accounts for the smallest share but has been increasing rapidly recently. This is due to efforts to expand renewable energy generation in order to meet the mid-term greenhouse gas reduction targets for 2030.
This study examines the effects of changes in the various energy sources on economic growth in South Korea. While previous research has primarily focused on the nexus between total energy consumption and economic growth, more recent studies have begun to explore the link between renewable energy and economic growth (Lee and Jung, 2018). However, Lee and Jung (2018) analyzed a period prior to 2012, before the widespread adoption of renewable energy, and considered only the relationship between renewable energy and economic growth, without accounting for other energy sources. In contrast, this study incorporates renewable energy, nuclear energy, and fossil fuels simultaneously to assess the specific effects of each energy source on economic growth.
Most previous studies did not distinguish between different energy sources and instead used total energy consumption or considered only renewable energy as a variable. In other words, they focused on analyzing the interrelationships among GDP, renewable energy, energy, capital, labor, and similar factors. However, in this analysis, not only renewable energy but also nuclear energy and fossil fuels are included.
Nuclear energy, as a large-scale base-load energy source, enables a stable electricity supply, thereby enhancing the stability of industrial production and contributing to the strengthening of manufacturing competitiveness. In addition, compared to other energy sources, nuclear energy exhibits relatively low fuel cost volatility, which helps stabilize electricity prices and, in turn, encourages corporate investment and reduces production costs. Furthermore, the development of nuclear related industries can generate value added, while the construction, operation, and export of nuclear power plants provide opportunities for industrial export expansion. Moreover, by reducing dependence on imported fossil fuels, nuclear energy can mitigate external vulnerability and enhance macroeconomic stability.
Fossil fuels, as high-energy-density sources, have supported economic growth by fostering the development of heavy and chemical industries, including petrochemicals. However, due to the high volatility of international oil prices, fossil fuels may contribute positively to economic growth during periods of low oil prices through cost reductions, whereas during periods of high oil prices they may hinder growth by increasing production costs and generating inflationary pressures.
Renewable energy, owing to its relatively high generation costs, may exert a negative impact on economic growth in the short run. Nevertheless, the expansion of renewable energy can serve as a new growth engine in the medium to long term by promoting emerging industries and creating employment opportunities. In addition, large-scale initial capital investment in renewable energy infrastructure can stimulate aggregate demand and contribute to short-term economic expansion.
Therefore, this analysis is the first to examine the impact of various energy sources, not just specific ones like renewable energy, on economic growth in the case of South Korea using ARDL framework. For the sake of analytical clarity, this study categorizes energy into three broad groups: renewable energy, nuclear energy, and fossil fuel energy. This classification is based on the premise that reducing fossil fuel consumption is essential for achieving greenhouse gas reduction goals, and it also serves to draw relevant policy implications. Both renewable energy and nuclear energy fall under the category of non-fossil fuels, meaning their use does not emit greenhouse gases. However, while renewable energy is closely linked to voluntary corporate efforts to reduce emissions, such as the RE100 initiative, nuclear energy is subject to various regulations due to its unique characteristics. Therefore, it is reasonable to analyze their respective impacts on economic growth separately.
Since this research focuses on a single country, the ARDL (Autoregressive Distributed Lag) methodology is employed. The analysis covers the period from 1990 to 2023. Although renewable energy began to increase significantly after 2010, the analysis period began in 1990 in order to estimate the impact of other energy sources, such as fossil fuels and nuclear energy, on economic growth.
The specific analytical methodology will be discussed in Chapter Ⅱ. Chapter Ⅲwill present the results of the empirical analysis, and Chapter Ⅳ will provide conclusions and policy implications.
Ⅱ. Methodology and Data
To evaluate the long-term cointegration among variables, this study employed the ARDL methodology as proposed by Pesaran and Pesaran (1997), Pesaran and Shin (1999), and Pesaran et al. (2001). The ARDL cointegration approach is regarded as more effective than the Johansen cointegration methods introduced by Engle and Granger (1987), as it produces reliable results even with small or finite samples and is applicable irrespective of whether the variables are I(0), I(1), or jointly cointegrated (Pesaran et al., 2001). The ARDL method also provides consistent estimators in the presence of endogeneity and autocorrelation, as evidenced by previous single-country studies conducted by Lee and Jung (2018), Minh and Van (2023), and Saba (2023).
The following equation can be employed to specify the long-run empirical model, capturing the effects of exogenous variables, including renewable energy, nuclear energy and fossil fuel energy on economic growth. The fossil fuel energy includes coal, oil and natural gas etc.:
where ln is the natural logarithm, GDP represents the gross domestic product of Korea (constant 2015 US$). LAB represents the labor force (person). CAP represents the gross fixed capital formation (constant 2015 US$). REW represents the renewable energy (1000 TOE), and NUC representing the nuclear energy (1000 TOE). FOSS represents the fossil fuel energy (1000 TOE). Total primary energy supply is the sum of the renewable energy, the nuclear energy and the fossil fuel energy The error term is denoted as .
The estimation of the ARDL models proceeds in three steps. The first step involves conducting an ARDL bounds test to ascertain whether a long-run cointegration relationship exists among the variables. Once cointegration is confirmed, the conditional error correction model can be specified using the following equation:
Equation (2) incorporates the first-difference operator, denoted by ∆, as well as the long-run coefficients . The optimal lag length, represented by 𝑝 and , is determined using the Akaike information criterion (AIC).
After establishing the presence of a cointegration relationship in the first step, the augmented ARDL model is estimated in the second step using the following equation:
The long-term coefficients of the ARDL model can be estimated as follows:
where, .
The steady-state long-run equilibrium, where all variables are constant over time and their first differences are zero. The final step involves capturing the short-run dynamics through the ARDL error correction model (ARDL-ECM) as specified below.
where, is the error term and represents the error correction term.
When the coefficients of () are both negative and statistically significant, the corresponding variables tend to converge toward the long-run equilibrium. The negative and significant error correction term further support the weak exogeneity of the explanatory variables.
The stability of the ARDL model is evaluated by the cumulative sum of recursive residuals (CUSUM) and the cumulative sum of squares of recursive residuals (CUSUMSQ) tests. The ARDL model estimation was performed using the EViews software package.
The specific data and sources are presented in <Table 2>. GDP, labor (LAB), and capital (CAP) were obtained from the World Bank’s DataBank, while renewable energy (REW), nuclear energy (NUC), and fossil fuel energy (FOSS) data were sourced from the Korea Energy Economics Institute.
<Table 2>
Data Sources
Ⅲ. Results
1. Unit root test
Before applying the ARDL approach, a unit root test should be conducted to determine whether the variables are I(0) or I(1) in order to assess their long-run cointegration relationships. As shown in <Table 3>, according to the Augmented Dickey-Fuller test (Dickey and Fuller, 1979) results, lnGDP and lnFOSS have test statistics that are significant at 1% significance level, indicating that these variables are stationary at level (i.e., they are I(0)). The other variables (lnLAB, lnCAP, lnREW and lnNUC) are not significant at level, suggesting they are non-stationary at level, but have highly significant test statistics at 1% significance level, implying that after first differencing, the variables become stationary (i.e., they are I(1)).
The Zivot-Andrews unit root test, which allows for an endogenous structural break, shows that lnCAP is integrated of order one (I(1)), whereas the remaining variables (lnGDP, lnLAB, lnREW, lnNUC, and lnFOSS) are stationary at level (I(0)).
Given that the time series includes both I(0) and I(1) variables, the ARDL bounds testing approach is appropriate, as it effectively handles mixed integration orders and allows for the analysis of both short- and long-run dynamics (Pesaran et al., 2001).
<Table 3>
Unit root tests
| Augmented Dickey-Fuller unit root test | |||
| Level | First difference | ||
| Variable | t-value | Variables | t-value |
| -4.813*** | -5.001*** | ||
| -2.183 | -4.874*** | ||
| -2.025 | -4.712*** | ||
| 0.265 | -9.040*** | ||
| -2.091 | -4.788*** | ||
| -4.344*** | -3.996*** | ||
| Zivot-Andrews unit root test | |||
| Level | First difference | ||
| Variable | t-value | Variables | t-value |
| -2.712** | -6.118 | ||
| -3.885*** | -5.718 | ||
| -5.275 | -6.157** | ||
| -5.629*** | -4.119 | ||
| -3.083** | -6.030** | ||
| -3.657*** | -4.233 | ||
2. ARDL Bounds test
An appropriate lag length was selected to prevent inaccurate estimations and ensure the reliability of the model. The AIC criteria was employed for selecting the appropriate lag length. The ARDL (1, 1, 2, 2, 2, 2) model showed the lowest AIC value. Therefore, the appropriate lag lengths for each variable, lnGDP, lnLAB, lnCAP, lnREW, lnNUC and lnFOSS correspond to , , , , and , respectively.
The ARDL bounds testing approach was applied to test for the presence of a long-run cointegration relationship among the variables. <Table 4> shows the bounds test results for the chosen ARDL model. The null hypothesis of the F-statistic bounds test assumes that no cointegration exists among the variables. In view of the relatively limited sample size, the critical bound values reported by Narayan (2005) were applied to assess the existence of a long-run cointegrating relationship.
The calculated F-statistics of the ARDL (1,1,2,2,2,2), with lnGDP as the dependent variable and lnLAB, lnCAP, lnREW, lnNUC and lnFOSS as independent variables, is 11.116. Since this value exceeds the 1% upper bound critical value of 4.15, it suggests that a long-run cointegrating relationship exists among the variables.
<Table 4>
Results of the ARDL bounds test
| ARDL (1,1,2,2,2.2) | ||
| Calculated F-statistic | 11.116*** | |
| Critical bounds of the F-statistic | I(0) | I(1) |
| 10% | 2.08 | 3.00 |
| 5% | 2.39 | 3.38 |
| 1% | 3.06 | 4.15 |
3. Short run dynamics
The short run dynamics of the impact of energy supplies on GDP are presented in <Table 5>. As anticipated, the lagged error correction term is -0.3917, negative and statistically significant, providing evidence of cointegration among the variables (Bahmani-Oskooee and Nasir, 2004). The estimated coefficient of -0.3917 implies that convergence to the long-run equilibrium takes slightly more than 2.5 years.
Based on the ARDL-ECM specification in equation (5), the short-run coefficient of the labor force () is 0.720 and highly significant at the 1% level, suggesting that an increase in the labor force raises GDP contemporaneously. The short-run coefficient of capital stock () is 0.221 and highly significant at the 1% level, suggesting that capital stock has an immediate positive effect on GDP. In contrast, the short-run coefficient of the lagged capital stock () is -0.079 and appropriately significant at the 5% level, suggesting that capital stock in the previous period slightly reduces GDP. However, since the contemporaneous effect of capital stock on GDP is larger than the lagged (t-1) effect, capital stock can be interpreted as having an overall positive impact on GDP in the short run.
The short-run coefficients of nuclear energy and its lagged term ( and ) are 0.066 and -0.073, respectively, with both coefficients being statistically significant at the 1% significance level. Because the contemporaneous effect of nuclear energy is positive whereas the lagged (t-1) effect is negative, it is hard to conclude that an increase in nuclear energy results in a short-run rise in GDP.
The short-run coefficients of fossil fuel energy and its lagged term ( and ) are 0.302 and -0.116, respectively, and both are highly significant at the 1% level. Since the contemporaneous effect is larger in magnitude than the lagged effect, fossil fuel energy is interpreted as exerting a positive impact on GDP in the short run. By contrast, the short-run coefficients of renewable energy and its lagged term ( and ) are -0.008 and -0.014, respectively, and neither is statistically significant at the 5% significance level). This result suggests that renewable energy supply does not have a statistically significant effect on GDP in the short run.
The results of this ARDL model are reliable, as confirmed by a series of diagnostic checks. Specifically, the model shows no evidence of serial correlation in the residuals, the residuals are normally distributed, and there is no issue of heteroskedasticity. These results confirm the model’s statistical validity. In this ARDL model, the Bai-Perron structural break test did not yield effective results due to the relatively small number of observations in comparison to the number of parameters.
<Table 5>
Short-run results based on ARDL (1,1,2,2,2,2)
| Variable | Coefficient | Standard Error | t-Statistics |
| () | 0.720*** | 0.153 | 4.690 |
| () | 0.221*** | 0.030 | 7.396 |
| () | -0.079** | 0.029 | -2.753 |
| () | -0.008 | 0.007 | -1.050 |
| () | -0.014* | 0.008 | -1.747 |
| () | 0.066*** | 0.019 | 3.434 |
| () | -0.073*** | 0.020 | -3.683 |
| () | 0.302*** | 0.040 | 7.622 |
| () | -0.116*** | 0.037 | -3.114 |
| () | -0.3917 | 0.037 | -10.344 |
| 0.9683 | |||
| Adjusted | 0.9554 | ||
| Durbin-Watson statistics | 2.0856 | ||
| Serial correlation () | 0.2769[0.8707] | ||
| Normality () | 2.1245[0.3456] | ||
| Heteroskedasticity () | 9.6944[0.8385] | ||
4. Long- run equilibrium
<Table 6> presents the reduced equation from Equation (4). The long-run coefficient of lnCAP is 0.167 and highly significant at the 1% level, suggesting that the long-run elasticity of capital stock to the GDP is 0.167 which means that 1% increase in capital stock increased 0.167% increase in GDP. The long-run coefficient of lnLAB is -0.058 but wasn’t statistically significant. The quality of labor (human capital, productivity) may matter more than mere head-count growth for long-term performance.
The energy supply could affect economic growth. The long-run coefficient of lnFOSS is 0.192 and highly significant at the 1% level, suggesting that 1% increase in fossil fuel supply increased 0.192% in GDP. The long-run coefficient of lnNUC is 0.097 and statistically significant at the 1% level, indicating that 1% increase in nuclear energy supply increased 0.097% increase in GDP. The long-run coefficient of lnREW is 0.032 and significant at the 10% level, but not significant at the 5% level. Furthermore, the effect of renewable energy on GDP remains modest, and on the basis of these results it is difficult to claim that renewable energy has yet made a substantial contribution to economic growth.
<Table 6>
Long-run results based on ARDL (1,1,2,2,2,2)
| ARDL (1,1,2,2,2,2) | ||
| Coefficient | Standard Error | |
| -0.058 | 0.206 | |
| 0.167*** | 0.048 | |
| 0.032* | 0.017 | |
| 0.079*** | 0.019 | |
| 0.192*** | 0.064 | |
A comprehensive look at how various energy sources affect economic growth in the long-run shows that, over the past 30 years in Korea, fossil fuels have had the greatest impact, followed by nuclear energy. As [Figure 1] and [Figure 2] show, fossil fuels have accounted for a large share of South Korea’s energy mix, and empirical results indicate that they have played a stable energy source role over the past three decades. In other words, sustained economic growth requires a stable energy supply, and prior to the widespread deployment of renewable energy, fossil fuels and nuclear energy were the only viable sources capable of fulfilling this role.
The share of nuclear energy has steadily increased over time, accompanied by the development of related industries. Moreover, its relatively low generation costs compared to other energy sources have contributed to comparatively low electricity prices. This has reduced corporate production costs, as well as overall economy-wide costs, thereby supporting economic growth.
In contrast, the effect of renewable energy on GDP remains modest. These findings are consistent with those reported by Lee and Jung (2018). Their study found that renewable energy has a negative effect on economic growth. Although renewable energy generation costs have declined in recent years, they remain higher than those of nuclear power and fossil fuels, particularly coal. From an industrial perspective, domestic industries have become less competitive. In the solar sector, for instance, domestic producers of polysilicon and wafers have been outcompeted by cheaper Chinese products. Competitiveness in solar cell and module manufacturing has also deteriorated in comparison to China. While there has been a gradual improvement in competitiveness in blade and tower manufacturing in the wind power industry, core technologies continue to lag behind those in Europe and China. Consequently, dependence on imports of wind power equipment and facilities remains high, posing challenges for domestic industrialisation.
Taking these circumstances into account, these structural and industrial constraints suggest that an increase of renewable energy would not have generated a positive contribution to economic growth during the period under consideration.
5. Model stability
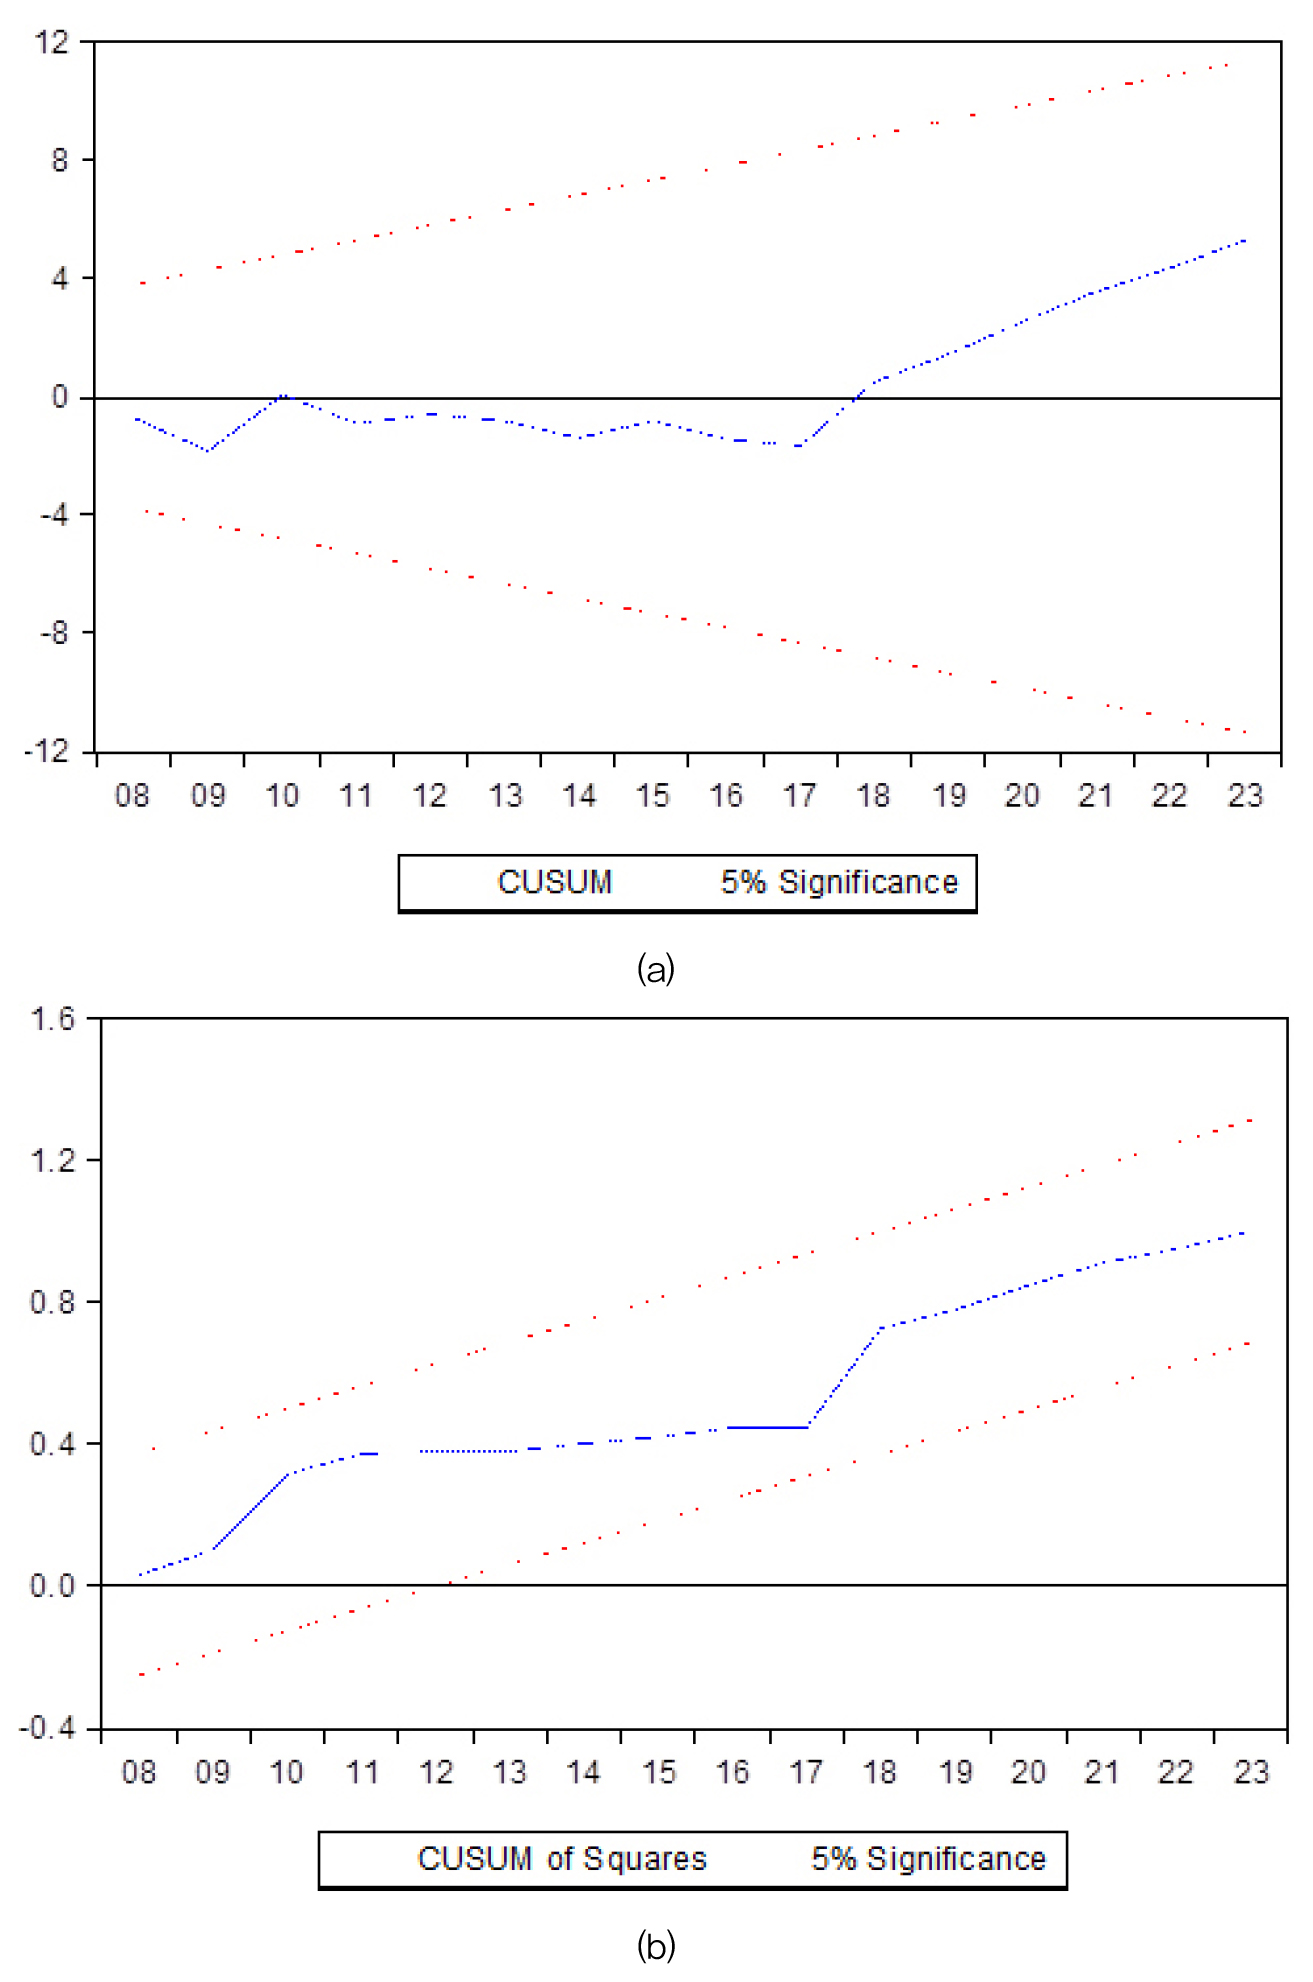
The stability of the coefficients was examined with recursive-residual CUSUM and CUSUMSQ tests. [Figure 3] displays the resulting diagnostics for each specification. In both plots, the test statistics remain within the 5% confidence bands for the full sample, confirming that all parameter estimates are stable over time.
Ⅳ. Conclusions
This study investigated the relationship between renewable energy, nuclear energy, fossil fuel energy, and economic growth. The analysis covers thirty-three years for the period from 1990 to 2023. To examine both short and long-run effects, the ARDL (Auto-regressive Distributed Lag) methodology was employed. While previous studies have primarily focused on the nexus between energy consumption and economic growth or the effect of a specific energy source on economic growth, this study examined a more detailed analysis for the effect of renewable energy, nuclear energy, and fossil fuels (such as coal, oil, and gas) on economic growth. The primary contribution of this study lies in its comprehensive analysis of the impacts of different types of energy on economic growth. In contrast to prior research, which has largely focused on individual energy sources, this study provides a differentiated assessment by categorizing and analyzing renewable energy, nuclear energy, and fossil fuels separately, thereby offering a more nuanced understanding of their respective effects.
According to this analysis, in the long-run, fossil fuels and nuclear energy have had a positive effect on economic growth. The positive effect of fossil fuels on economic growth was found to be greater than that of nuclear energy. However, the effect of renewable energy on economic growth appeared to be minimal. In the short-run as well, fossil fuels had an immediate positive effect on economic growth, consistent with the long-run results. However, the effect of renewable energy remained minimal in the short-run. The reason why renewable energy has had only a minimal effect on economic growth is that in South Korea, it has been only about 10 years since renewable energy began to be widely adopted, and even now, its share in the primary energy supply remains below 10%.
In the case of labor force, while it exhibited a positive impact on economic growth in the short run, such an effect was not evident in the long run. This implies that an increase in the quantity of labor force alone does not necessarily contribute to sustained economic growth. Rather, it suggests that the qualitative structure of the labor force may have played a more critical role in influencing long-run economic performance. However, the present analysis does not consider qualitative aspects of labor, such as educational attainment and skill levels, because its primary focus is on the relationship between the energy mix and economic growth. Consideration of labor quality is therefore reserved for future research.
Capital accumulation, on the other hand, demonstrated a consistently positive effect on economic growth in both the short and long-run. Among the factors analyzed, capital accumulation exerted the most significant positive influence on economic growth. This finding reflects that South Korea’s economic growth over the past thirty years has been largely driven by capital-intensive industries, including semiconductors, automobiles, and consumer electronics.
According to this analysis, Over the past 30 years, South Korea has achieved economic growth based on fossil fuels and nuclear energy. However, fossil fuels are not environmentally friendly as they cause negative externalities such as air pollution and global warming. Furthermore, the social costs of fossil fuels are not reflected in GDP. To effectively respond to climate change and ensure sustainable economic development, a transition toward low-carbon energy sources is imperative. Accordingly, as the transition from fossil fuels to renewable energy accelerates, it is expected that renewable energy will begin to exert a more positive influence on economic growth. However, in order to achieve both the widespread adoption of renewable energy and sustained economic growth, it is essential to foster the concurrent development of industries related to renewable energy. Specifically, efforts should be made to diversify the supply sources of solar photovoltaic (PV) equipment while simultaneously strengthening the competitiveness of the domestic solar industry. In the long term, technological development should facilitate the transition to next-generation solar technologies. Similarly, in order to enhance the competitiveness of the wind power industry, it is necessary to bolster technological development capabilities and to establish government incentives that promote the adoption of domestically produced equipment.
Furthermore, as suggested by Lim and Jo (2017), renewable energy promotion policies should be diversified beyond the currently implemented Renewable Portfolio Standard (RPS), including the possible introduction of a Feed-In Tariff (FIT) scheme.
A limitation of this study is that structural discontinuities, such as the financial crisis during the analysis period, electricity market reforms, nuclear energy policies and renewable energy expansion policies, are not accounted for in the model. This is a limitation of the ARDL framework, and future research should address this by applying time-series methodologies that incorporate structural breaks and regime changes.
Another limitation of this study is that, in order to focus on the detailed effects of different energy types on economic growth, the analyses of labor and capital were conducted in a simplified manner. Specifically, labor could be further disaggregated into skilled and unskilled categories, as their impacts on economic growth may differ. Similarly, the effect of capital on economic growth may vary depending on the nature or type of capital. However, these aspects are left for future research.
