

Ⅰ. Introduction
Ⅱ. Background information and data
1. Background information
2. Data
Ⅲ. Empirical analysis
1. Empirical model
2. Estimation results
3. Robustness
IV. Conclusion
Ⅰ. Introduction
Changes in taxes, input prices, and exchange rates can result in a cost shock, which a firm usually passes to its prices. A substantial body of work documented and explained the pattern of a pass-through (Borenstein et al., 1997; Goldberg and Hellerstein, 2008; Lewis and Noel, 2011), the asymmetry and non-linearity of a pass-through (Peltzman, 2000), and its size and speed (Fabra and Reguant, 2014). Other studies used the pass-through as a tool to recover the underlying market structure (Bonnet et al., 2013; Hong and Li, 2017). Conversely, little is known about pass-through variations between firms, and if such variations exist, the implications of such pass-through heterogeneity remain unexplored. This is an important issue in that consumers may be affected differently by a cost shock.
This paper examines the extent to which cost pass-through at a retailer is affected by its attributes and local market conditions in the context of the South Korean automotive fuel market. For this goal, this paper focuses on two periods of falling oil prices: (i) between July 2013 and December 2014 and (ii) between November 2019 and April 2020. An oversupply of petroleum and the global economic recession caused the crude oil price to plunge by nearly 60 percent during the first period. Also, the outbreak of the COVID-19 pandemic led to a sharp drop in oil prices during the second period. Given the asymmetry of pass-through, it would be advantageous to focus on such one-off cost shocks.
This paper collects the price and non-price data on the universe of gas stations in South Korea during the first period and on gas stations in Seoul Metropolitan Area (henceforth SMA) during the second period. Examination of the heterogeneous price responses to the decrease in the crude oil price reveals that a one percent decrease in the crude oil price leads to an average decrease of 0.16 – 0.28 percent in the retail fuel price. This seemingly low pass-through rate can be attributed to the significant excise taxes on fuels that make percentage changes in retail prices smaller than a percentage change in the crude oil price. The average cent-for-cent pass-through is over 0.8, implying that a one-cent drop in the crude oil price leads to 0.8 cent drop in retail fuel prices.
Importantly, there is evidence that cost pass-through varies across gas stations depending on their characteristics. More specifically, doubling the degree of competition within 0.2 miles causes a gas station to increase its pass-through rate by about one percentage points. Hence, competition increases consumer benefits from falling oil prices. Also, compared to other stations, the pass-through rate is higher by 1.3 – 2.6 percentage points and by about one percentage point at self-service and thrifty stations, respectively. These findings suggest that lower-income consumers may benefit more from falling oil prices than high-income consumers, as they are more price-sensitive (West, 2004; West and Williams III, 2004) and hence are more likely to fuel their vehicles in these two types of stations. Additionally, retail fuel prices tend to be less cost-reflective at a premium station than at a non-premium station. Therefore, the benefit for higher-income consumers from an oil price decrease would be relatively lower, as they are less price-sensitive and would visit premium stations more often than low-income consumers (Ahlin et al., 2021). Comparing cent-for-cent pass-through rates across stations instead of pass-through elasticities leads to conclusions that are qualitatively the same.
This paper also estimates the direct effects of the station characteristics and market conditions on retail fuel prices. In line with previous literature (Hastings, 2004; Cooper and Jones, 2007), competition from nearest neighbors has a strong negative effect on price. More specifically, doubling the number of competitors in the immediate proximity induces the price to decrease by 0.2 to 0.3 percent nationwide and by 1.5 to 2.1 percent in SMA. Therefore, price effect of competition is much larger in densely populated areas. Also, prices at a station decrease by more than two percent after conversion to self-service or thrifty type, whereas a premium station seem to charge higher fuel fees than non-premium stations.
This study shows that these empirical findings remain robust after addressing non-linearity or a delay in pass-through. Overall, the results suggest that station characteristics and market conditions affect retail fuel prices directly and indirectly through pass-through. Competition causes retail prices to decrease and be more cost-reflective. Fuels are cheaper (more expensive, respectively) at self-service and thrifty stations (premium stations) and become even cheaper (more expensive) relative to other stations when oil prices fall. These strategic behaviors are consistent with the findings of Kim (2021) who showed that competition causes gas-stations to evolve in different ways and target different types of consumers. The evidence found in this paper suggests that consequently, low-income consumers are likely to benefit the most from an oil price decrease.
Several papers studied the distributional implications of cost shocks. Cravino and Levchenko (2017) showed that a significant exchange rate devaluation causes the living cost of low-income households to rise relatively more than high-income households. Kpodar and Abdallah (2017) found that fuel price pass-through is the lowest in developing countries and the highest in advanced countries. Stolper (2018) found no evidence that crude oil price pass-through changes with wealth1). Utilizing the temporal reduction of the fuel tax in South Korea between November 2018 and May 2019, Jang (2020) found that the tax cut might have benefitted consumers with high price elasticity the most. This paper contributes to the literature by showing that falling oil prices may be more advantageous for low-income consumers. Also, several papers explored the effect of competition on pass-through. Doyle Jr and Samphantharak (2008), Antoniades and Zaniboni (2016), and Stolper (2018) found evidence that pass-through is lower in a more competitive environment. Conversely, Cabral et al.(2018) showed that market power is negatively associated with pass-through in health insurance markets. Similar to the finding of Genakos and Pagliero (2021) who examined tax pass-through in the isolated retail fuel markets, this paper shows that cost pass-through is higher for markets with more competitors.
The paper is organized as follows. The next section provides background information and describes the data. Section III examines the heterogeneous price responses to the decreasing crude oil price depending on the station characteristics and local market conditions, and tests the robustness of the empirical findings. Section IV concludes.
Ⅱ. Background information and data
1. Background information
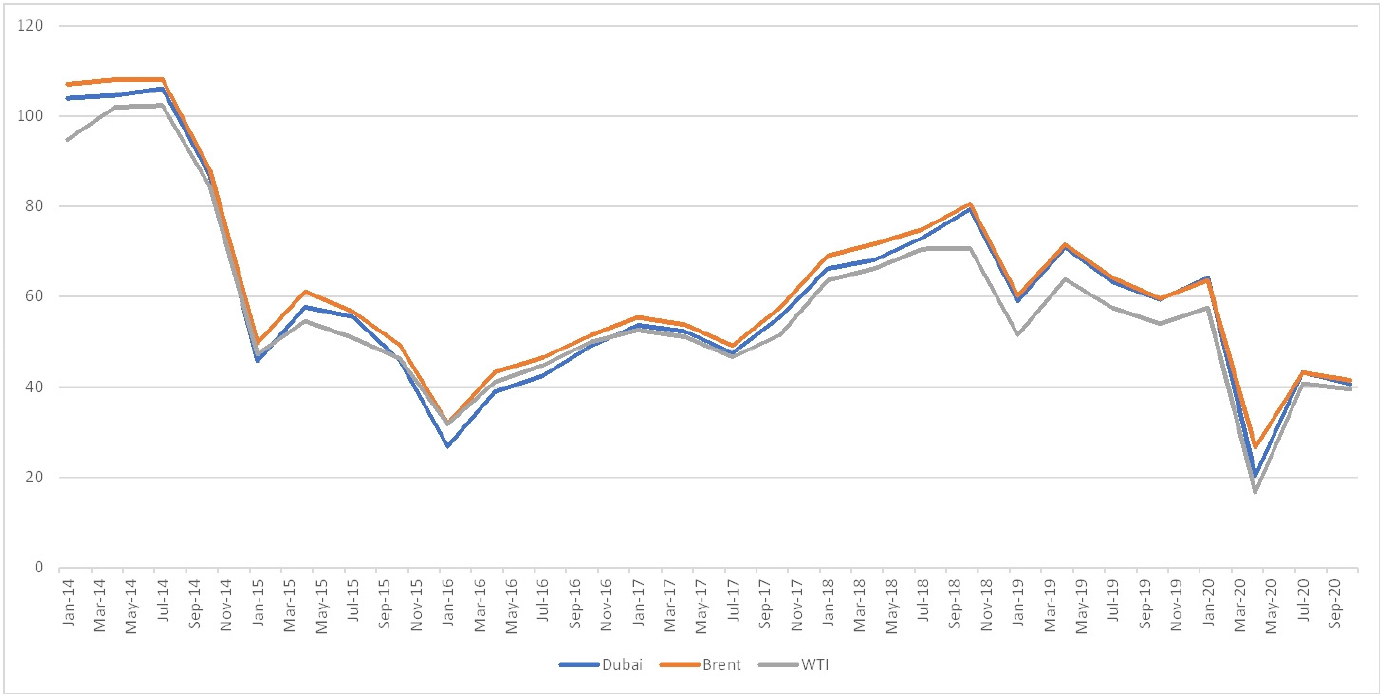
<Figure 1> shows that crude oil prices plunged twice over the last seven years. They fell by nearly 60 percent between mid-2014 and early 2015 due to an oversupply of petroleum and the global economic recession. Also, the outbreak of COVID-19 pandemic caused the cured oil prices to plunge by 70 percent during the first four months of 2020. This paper exploits these substantial drops in oil prices to examine the extent to which cost pass-through at a gas station is affected by its observed characteristics and local market conditions.
South Korea’s oil industry is heavily concentrated and dominated by a few vertically integrated firms, similar to other countries, such as China and the United States. Table A1 in the appendix shows that four firms operate in both upstream refinery and downstream retail fuel markets. While their combined market share is 87 percent in the retail fuel market, independently-owned stations represent five percent, and government-supported thrifty stations own eight percent. Introduced to the market at the end of 2011 by the Korean government with the aim of lowering retail fuel prices, the thrifty stations are not only aided with tax remission and subsidy by the government, but also provided with the fuel at a lower cost from the Korea National Oil Corporation (KNOC), South Korea’s state-run oil and gas company2).
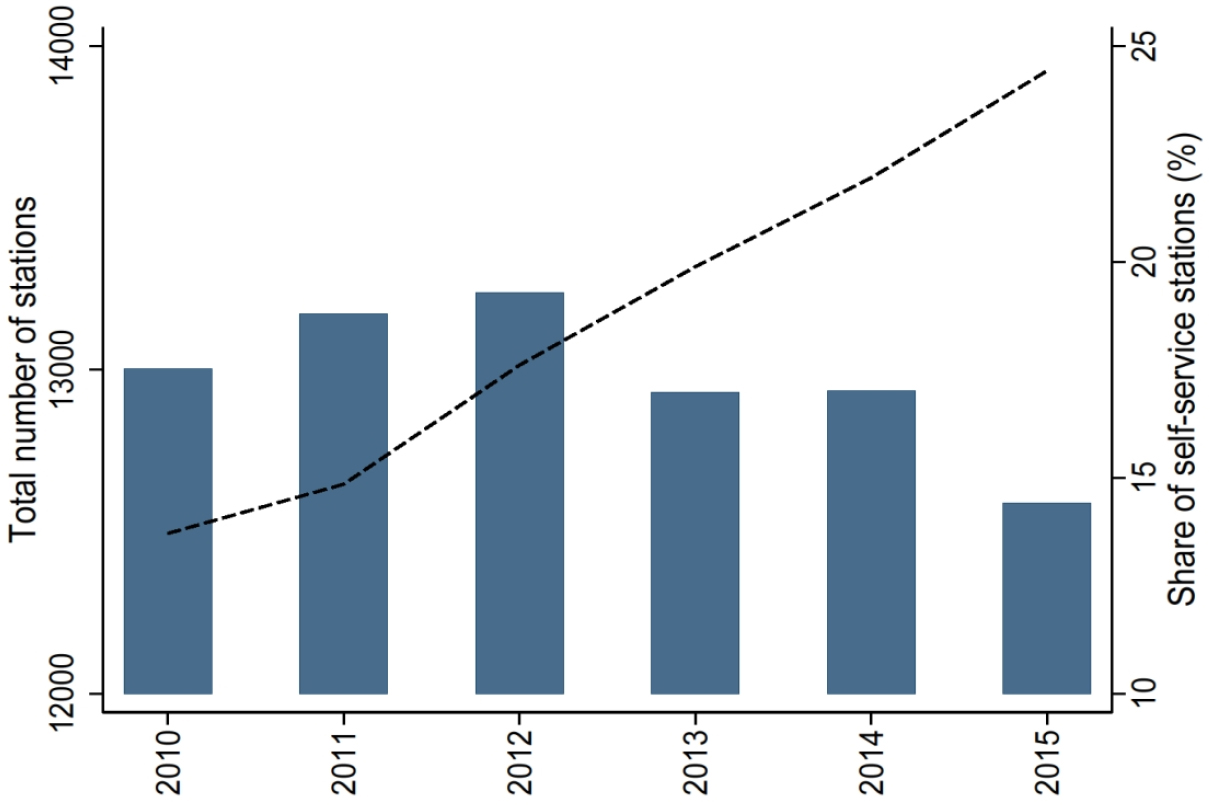
Unlike regular gasoline and diesel sold at almost every gas station in South Korea, premium gasoline is available only in large stations with a range of fuel products3). Similar to Ahlin et al.(2021), this study defines gas stations with attendants that sell premium gasoline as premium stations. Also, it had long been standard in South Korea that attendants pump fuel in gas stations; however, according to Figure A1 in the appendix, the proportion of self-service stations rose from 14 percent in 2010 to 24 percent in 2015. Given that the total number of stations did not increase over the years, this implies that many incumbents converted to self-service to cut labor costs.
2. Data
Every month, KNOC posts retail gasoline and diesel prices from each gas station and after-tax wholesale fuel prices from each retail chain on its website4). The data also provide non-price information for each station, such as the type of fuel delivery (self-service or not) and the chain’s name. These monthly cross-sectional data are downloaded and combined into two separate panel data sets. The first data set includes all gas stations in South Korea between July 2013 and December 2014, while the second data set includes gas stations in SMA between November 2019 and April 2020. As shown in Figure 1, these periods are characterized by plunge in crude oil prices. There are 214,201 and 19,126 observations from 12,700 and 3,235 gas stations in the first and second data sets, respectively. Then, for each gas station, the longitude and latitude are obtained from the address information, and the number of competitors is determined within each of four distance bands: 0-0.2, 0.2-1, 1-2, and 2-3 miles.
Table 1 presents descriptive statistics of the key variables. According to the table, the average retail gasoline and diesel prices are approximately 1,850 and 1,650 KRW (equivalent to 1.6 and 1.4 USD) per liter in the first sample data. The average retail fuel prices in the second sample data are 17-20 percent lower than those in the first sample data. The fuel tax, which did not change during the two sample periods, accounts for the large gap between the retail fuel prices and the crude oil (Brent) price5). The number of direct competitors, that is, the rival stations in proximity (within 0.2 miles) of a station, is about 0.5 on average. The average number of rivals within the next three distance bands rises to 5.5, 12.7, and 17 in the first data set and to 5.4, 14.1, and 21.3 in the second data set. This is reasonable given that the area covered by the 1-2 distance band is broader than the area covered by the 0.2-1 distance band but narrower than the area covered by the 2-3 distance band. The table also shows that the fraction of self-service stations is much larger during the second sample period (51 percent) compared to the first sample period. This observation shows that conversion to self-service type actively took place in between the two sample periods.
<Table 1>
Descriptive statistics
Ⅲ. Empirical analysis
This section estimates the empirical pass-through models using the two sample data sets separately, and discusses the empirical findings. Then, a number of robustness checks are carried out.
1. Empirical model
This study takes a reduced-form approach and estimates a pass-through model that allows for heterogeneous price responses to a cost shock:
where subscripts i and t represent gas station and time (year-month), respectively6). The log of the retail fuel (either gasoline or diesel) price is ln price, and ln cprice is the log of the crude oil (Brent) price7). Lagged values of the crude oil price are not included in the model as this paper focuses on heterogeneous price responses across stations rather than precisely measuring the average pass-through8). Vector z includes the log number of competing gas stations located in each of the four distance bands defined in the previous section and three indicators for self-service, thrifty, and premium stations. The log of the crude oil price is interacted with x, a subset of z, containing the three indicators and the log number of direct competitors located within 0.2 miles. Then, coefficients in vector β capture pass-through heterogeneity depending on the station characteristics in vector x, while coefficient α captures the average pass-through rate. Station fixed effects are included in the model controlling for unobserved station attributes. Therefore, the model identification exploits the within-station variations in the regressor values and the time-varying cost shock. Error term ε is station and time-specific.
2. Estimation results
First, model (1) is estimated using the first sample data that cover the universe of gas stations in South Korea between July 2013 and December 2014. The first five and next five columns of Table 2 report estimation results using the log retail gasoline price and the log retail diesel price as the dependent variable, respectively9). The R-squared value is around 0.9 in all specifications, indicating that most of the price variations can be explained by variations in the explanatory variables. Estimates show that the average pass-through rate is around 0.3; therefore, a one percent decrease in the crude oil price leads to a 0.3 percent decrease in the retail fuel price. This seemingly low pass-through rate is due to the significant excise taxes on fuels that make percentage changes in retail prices smaller than a percentage change in the crude oil price10). When model (1) is estimated in levels rather than logs, a one-cent drop in the crude oil price leads to more than 0.8 cent drop in retail fuel prices, as shown in Table A3 in the appendix. This high pass- through rate is in line with findings of the previous works on pass-through in the retail fuel market (Alm et al., 2009; Marion and Muehlegger, 2011; Genakos and Pagliero, 2021).
<Table 2>
Heterogeneous cost pass-through: July 2013 - December 2014
Importantly, the size of the cost pass-through rate differs across stations depending on the observed attributes. First, a gas station raises its cost pass-through rate by 1.2-1.3 percentage points when the degree of competition within 0.2 miles doubles. Given that the crude oil price continued to decline throughout the sample period, this finding implies that retail prices decreased more at stations facing higher competition11). The results also reveal that the pass-through rate is higher by 1.6-1.9 percentage points in a self-service station than an attended station. This implies that a self-service station responds more to a cost shock in the absence of the labor cost that drives a wedge between retail and crude oil prices12). Similarly, the cost pass-through rate is higher by 1-1.1 percentage points in a thrifty station than a non-thrifty one, suggesting that its cost advantage is embodied in the higher cost pass-through rate. Consistently, estimation results of pass-through model (1) in levels reported in Table A3 in the appendix show that cent-for-cent pass-through is higher at self-service and thrifty stations than at other types of gas stations. They also suggest that lower-income consumers might have benefitted more from the plunge in oil prices during the sample period, as they are more likely to fuel their vehicles at these two types of stations. Conversely, the results show that a premium station’s retail fuel prices tend to be less cost-reflective. Given that consumers in more affluent areas are less price-sensitive (West, 2004; West and Williams III, 2004) and more likely to fuel their vehicles at premium stations (Ahlin et al., 2021), they might have benefitted the least from the oil price collapse.
Table 2 also presents the direct effects of the station characteristics and market conditions on retail fuel prices. As expected, competition negatively affects the retail price. More specifically, doubling the competition intensity in the near proximity (within one mile) of a gas station induces the station to lower its prices by 1-3 percent. However, the retail price does not appear to decrease with the number of competitors beyond 1 mile. Previous works have documented this localized nature of the competition in the retail gasoline market (Hastings, 2004; Barron et al., 2004; Hosken et al., 2008). The estimation results also reveal that conversion to self-service induces a gas station to reduce its prices by more than 2 percent. Together with the high pass-through rate estimated above, this price competitiveness may explain why the share of self-service stations continued to rise over time in South Korea, as shown in Figure A1 in the appendix. Similarly, a thrifty station offers lower fuel prices to consumers thanks to the government’s support, whereas prices are 0.3-0.5 percent higher in a premium station compared to a non-premium station.
Next, model (1) is estimated using the second sample data that cover gas stations in SMA between November 2019 and April 2020. Estimation results presented in Table 3 are qualitatively the same as those obtained from using the first data set. That is, cost pass-through is heterogeneous in that it is higher at gas stations located in more competitive environment and at self-service and thrifty stations. For instance, cost pass-through rate increases by about 1 percentage point in response to a 100 percent increase in the number of direct competitors. In contrast, in response to falling crude oil prices a premium station decreases its fuel prices less compared to a non-premium station. Therefore, the heterogeneous price responses to the decreasing crude oil price is not sensitive to the choice of the sample period.
<Table 3>
Heterogeneous cost pass-through: November 2019 - April 2020
Additionally, estimates in Table 3 show that the average pass-through rates (about 0.16 for gasoline and 0.21 for diesel) are lower compared to those reported in Table 2, potentially due to the lower oil and fuel prices during the second sample period. Interestingly, estimates of the direct effects of competition are much larger compared to those from using the first sample data; the fuel price decreases by 1.5-2.1 percent when the competition degree is doubled. This finding implies that the local market size is much smaller for gas stations in a densely populated area such as SMA13).
3. Robustness
This subsection checks the robustness of the empirical findings using the first sample data.14) First, it may take a few weeks for a gas station to complete adjusting its prices in response to a cost shock. Indeed, Figure 1 shows that the decreasing trend in retail fuel prices continued until February 2015, whereas crude and wholesale prices began to bounce back from the same month.15) The lagged crude oil price and its interactions with the station characteristics are included in pass-through model (1) to address this issue. According to estimation results reported in Table A4 in the appendix, there is a price adjustment delay after a cost shock16). The results also show that pass-through is still heterogeneous across gas stations, depending on their characteristics. Therefore, the main findings of the previous section are robust to the inclusion of the lagged crude oil price in the model.
According to Figure 1, the drop in oil prices was the most prominent during the second half of 2014. Therefore, to dissect any non-linearity in price responses to a cost shock (Pollard and Coughlin, 2004; Caselli and Roitman, 2019; Kim et al., 2018), the first sample period is now divided into two subperiods, (i) July 2013–June 2014 and (ii) July–December 2014. The average month-to- month change in crude oil (Brent) price is -0.5 percent during the first period and -7.7 percent during the second period. Then, model (1) is estimated using observations of each subsample separately. Estimates reported in Table A5 in the appendix suggest that pass-through is much higher during the first period. Therefore, fuel prices tend to be less cost-reflective when the decrease in crude oil prices is larger. Results also show that the impact of a cost shock depends on station characteristics in both subperiods. Hence, cost pass-through seems to be heterogeneous, regardless of the size of a cost shock.
Finally, the variable, ln cprice, is replaced in model (1) with time (year-month) fixed effects while keeping its interactions with the station attributes, xit×ln cpricet, in the model.17) This replacement has the advantage of controlling for changes in the crude oil price and other unobserved time-varying factors that affect all gas stations equally. At the same time, pass-through heterogeneity is still captured by coefficients in vector β. In addition to time-fixed effects, this study also considers region-time fixed effects and retail chain-time fixed effects one after another. They control for both observed and unobserved shocks common across all stations in the same region at a given time (region-time fixed effects) or of the same chain at a given time (chain-time fixed effects), addressing the endogeneity concern to the extent that these shocks are correlated with station characteristics. Estimates reported in Table A6 in the appendix are similar in size across different specifications and consistent with Table 218).
In sum, these robustness checks in this section confirm that the station characteristics and market conditions may affect how much of a cost shock is passed through to consumers. Competition from nearby stations makes a gas station decrease its prices and be more responsive to a cost shock. While gasoline and diesel are cheaper at self-service and thrifty stations, they become even cheaper than fuels at other stations when oil prices fall. In contrast, premium stations set prices higher and show a lower rate of cost pass-through.
IV. Conclusion
This paper examines pass-through heterogeneity at the firm level, which is an important topic given that consumers may be differently affected by changes in firms’ input costs. This study takes advantage of the substantial decrease in oil prices during the second half of 2014 and during the first four months of 2020, and finds that pass-through varies across gas stations depending on their characteristics. Retail prices are more cost-reflective at stations under higher competition and self- service or thrifty stations; hence, consumers of these gas stations would benefit the most from an oil price decrease. Conversely, a premium station has a lower pass-through rate than a non-premium station, lessening the benefit for its consumers, primarily those with higher income, from a plunge in oil prices.
These findings would be useful to policymakers concerned with the distributional effects of changes in the fuel tax. A fuel tax cut would be progressive, at least in the market analyzed in this paper, in that it is more advantageous for lower-income consumers. Given the asymmetry in pass-through, however, it requires another analysis to examine how differently consumers are affected by an increase in oil prices or a tax hike.
◎ Appendix ◎
<Table A1>
Oil industry in South Korea in 2014
<Table A2>
Heterogeneous wholesale pass-through
<Table A3>
Heterogeneous cent-for-cent pass-through
<Table A4>
Delay in price adjustment
| Variable | Gasoline | Diesel | ||
| Coeff. | Std. Err. | Coeff. | Std. Err. | |
| ln(Crude oil price) | 0.149 | (0.001)*** | 0.177 | (0.001)*** |
| Lagged | 0.202 | (0.002)*** | 0.213 | (0.002)*** |
| ln(Crude oil price)× ln(N0−.2) | 0.013 | (0.002)*** | 0.016 | (0.002)*** |
| Lagged | -0.004 | (0.002) | -0.007 | (0.003)*** |
| ln(Crude oil price)×Self-service | 0.020 | (0.002)*** | 0.024 | (0.003)*** |
| Lagged | -0.010 | (0.004)*** | -0.013 | (0.004)*** |
| ln(Crude oil price)×Thrifty | 0.002 | (0.004) | -0.003 | (0.004) |
| Lagged | 0.012 | (0.006)* | 0.022 | (0.005)*** |
| ln(Crude oil price)×Premium | -0.000 | (0.004) | -0.009 | (0.004)** |
|
Lagged ln(N0−.2) |
-0.030 -0.002 | (0.007)*** (0.001)** |
-0.027 -0.003 | (0.008)*** (0.001)*** |
| ln(N.2−1) | -0.003 | (0.001)*** | -0.002 | (0.001)** |
| ln(N1−2) | -0.001 | (0.001) | 0.000 | (0.001) |
| ln(N2−3) | -0.000 | (0.001) | 0.000 | (0.001) |
| Self-service | -0.019 | (0.002)*** | -0.022 | (0.002)*** |
| Thrifty | -0.021 | (0.002)*** | -0.023 | (0.002)*** |
| Premium | 0.004 | (0.002)** | 0.004 | (0.002)** |
| Fixed Effects | ||||
| Station | Yes | Yes | ||
| R-squared | 0.909 | 0.919 | ||
| Number of stations | 12,658 | 12,658 | ||
| Observations | 212,480 | 212,480 | ||
<Table A5>
Non-linearity in pass-through
| Variable | Jul 2013 - Jun 2014 | Jul - Dec 2014 | ||
| Gasoline | Diesel | Gasoline | Diesel | |
| ln(Crude oil price) | 0.441*** | 0.374*** | 0.252*** | 0.279*** |
| (0.002) | (0.002) | (0.001) | (0.001) | |
| ln(Crude oil price)×ln(N0−0.2) | 0.028*** (0.004) | 0.022*** (0.004) | 0.007*** (0.001) | 0.008*** (0.001) |
| ln(Crude oil price)×Self-service | 0.028*** (0.004) | 0.018*** (0.004) | 0.017*** (0.001) | 0.017*** (0.001) |
| ln(Crude oil price)×Thrifty | 0.015*** (0.004) | 0.015*** (0.004) | 0.012*** (0.001) | 0.009*** (0.001) |
| ln(Crude oil price)×Premium | -0.102*** | -0.097*** | 0.005 | -0.005 |
| (0.013) | (0.014) | (0.003) | (0.003) | |
| ln(N0−0.2) | -0.001 | -0.001 | -0.003** | -0.005*** |
| (0.001) | (0.001) | (0.001) | (0.002) | |
| ln(N0.2−1) | -0.003*** | -0.002*** | -0.001 | -0.000 |
| (0.001) | (0.001) | (0.001) | (0.001) | |
| ln(N1−2) | -0.002*** | -0.002** | -0.002 | -0.001 |
| (0.001) | (0.001) | (0.001) | (0.001) | |
| ln(N2−3) | -0.001* | -0.001 | 0.001 | 0.001 |
| (0.001) | (0.001) | (0.001) | (0.001) | |
| Self-service | -0.018*** | -0.020*** | -0.022*** | -0.026*** |
| (0.002) | (0.002) | (0.003) | (0.003) | |
| Thrifty | -0.016*** | -0.018*** | -0.013*** | -0.014*** |
| (0.002) | (0.002) | (0.003) | (0.003) | |
| Premium | -0.000 | 0.000 | 0.007*** | 0.006*** |
| (0.001) | (0.002) | (0.002) | (0.002) | |
| Fixed Effects | ||||
| Station | Yes | Yes | Yes | Yes |
| R-squared | 0.629 | 0.540 | 0.936 | 0.936 |
| Number of stations | 12,514 | 12,514 | 12,202 | 12,202 |
| Observations | 142,852 | 142,852 | 71,349 | 71,349 |
<Table A6>
Controlling for unobserved time-varying factors
| Variable | Gasoline | Diesel | ||||
| (1) | (2) | (3) | (4) | (5) | (6) | |
| ln(Crude oil price)×ln(N0−.2) | 0.010*** | 0.009*** | 0.010*** | 0.012*** | 0.009*** | 0.011*** |
| (0.001) | (0.001) | (0.001) | (0.001) | (0.001) | (0.001) | |
| ln(Crude oil price)×Self-service | 0.016*** | 0.015*** | 0.015*** | 0.018*** | 0.017*** | 0.017*** |
| (0.001) | (0.001) | (0.001) | (0.001) | (0.001) | (0.001) | |
| ln(Crude oil price)×Thrifty | 0.011*** | 0.012*** | 0.029*** | 0.012*** | 0.013*** | 0.018*** |
| (0.001) | (0.001) | (0.003) | (0.001) | (0.001) | (0.003) | |
| ln(Crude oil price)×Premium | -0.017*** | -0.014*** | -0.016*** | -0.023*** | -0.018*** | -0.022*** |
| (0.003) | (0.003) | (0.003) | (0.004) | (0.004) | (0.004) | |
| ln(N0−.2) | -0.003*** | -0.003*** | -0.003*** | -0.004*** | -0.004*** | -0.004*** |
| (0.001) | (0.001) | (0.001) | (0.001) | (0.001) | (0.001) | |
| ln(N.2−1) | -0.003*** | -0.003*** | -0.003*** | -0.002*** | -0.003*** | -0.003*** |
| (0.001) | (0.001) | (0.001) | (0.001) | (0.001) | (0.001) | |
| ln(N1−2) | -0.002** | -0.002** | -0.002** | -0.001 | -0.001 | -0.001 |
| (0.001) | (0.001) | (0.001) | (0.001) | (0.001) | (0.001) | |
| ln(N2−3) | -0.001 | -0.001* | -0.001 | -0.001 | -0.001 | -0.001 |
| (0.001) | (0.001) | (0.001) | (0.001) | (0.001) | (0.001) | |
| Self-service | -0.017*** | -0.017*** | -0.017*** | -0.020*** | -0.020*** | -0.019*** |
| (0.002) | (0.002) | (0.001) | (0.002) | (0.002) | (0.002) | |
| Thrifty | -0.017*** | -0.015*** | -0.022*** | -0.020*** | -0.015*** | -0.030*** |
| (0.002) | (0.002) | (0.003) | (0.002) | (0.002) | (0.004) | |
| Premium | 0.003 | 0.003* | 0.002 | 0.003* | 0.004* | 0.003 |
| (0.002) | (0.002) | (0.002) | (0.002) | (0.002) | (0.002) | |
| Fixed Effects | ||||||
| Station | Yes | Yes | Yes | Yes | Yes | Yes |
| Time | Yes | No | No | Yes | No | No |
| Region-Time | No | Yes | No | No | Yes | No |
| Chain-Time | No | No | Yes | No | No | Yes |
| R-squared | 0.924 | 0.929 | 0.926 | 0.927 | 0.931 | 0.928 |
| Number of stations | 12,700 | 12,700 | 12,700 | 12,700 | 12,700 | 12,700 |
| Observations | 214,201 | 214,201 | 214,201 | 214,201 | 214,201 | 214,201 |
<Table A7>
Alternative pass-through model with log price changes
| Variable | Gasoline | Diesel | ||
| (1) | (2) | (3) | (4) | |
| ∆ln(Crude oil price) | 0.212*** | 0.145*** | 0.228*** | 0.157*** |
| (0.001) | (0.001) | (0.001) | (0.001) | |
| Lagged | 0.195*** | 0.203*** | ||
| (0.001) | (0.001) | |||
| ∆ln(Crude oil price)×∆ln(N0−0.2) | 0.008*** (0.001) | 0.008*** (0.001) | 0.009*** (0.001) | 0.009*** (0.001) |
| ∆ln(Crude oil price)×∆Self-service |
0.097*** (0.029) |
0.101*** (0.030) |
0.111*** (0.034) |
0.114*** (0.034) |
| ∆ln(Crude oil price)×∆Thrifty |
0.106* (0.058) |
0.109* (0.061) |
0.087* (0.046) |
0.088* (0.048) |
| ∆ln(Crude oil price)×∆Premium | -0.033** | -0.028** | -0.024 | -0.018 |
| (0.013) | (0.014) | (0.015) | (0.015) | |
| ∆ln(N0−0.2) | -0.000 | -0.001* | -0.001 | -0.001** |
| (0.001) | (0.000) | (0.001) | (0.000) | |
| ∆ln(N0.2−1) | -0.001*** | -0.002*** | -0.001** | -0.002*** |
| (0.000) | (0.000) | (0.000) | (0.000) | |
| ∆ln(N1−2) | -0.000 | -0.001** | -0.000 | -0.001** |
| (0.000) | (0.000) | (0.000) | (0.000) | |
| ∆ln(N2−3) | 0.000 | -0.000 | 0.001 | -0.000 |
| (0.000) | (0.000) | (0.001) | (0.000) | |
| ∆Self-service | -0.012*** | -0.012*** | -0.014*** | -0.014*** |
| (0.002) | (0.002) | (0.003) | (0.003) | |
| ∆Thrifty | -0.009*** | -0.009*** | -0.009*** | -0.009*** |
| (0.002) | (0.003) | (0.003) | (0.003) | |
| ∆Premium | 0.002 | 0.002 | 0.002 | 0.002 |
| (0.001) | (0.002) | (0.002) | (0.002) | |
| Fixed Effects | ||||
| Station | Yes | Yes | Yes | Yes |
| R-squared | 0.573 | 0.672 | 0.578 | 0.672 |
| Number of stations | 12,658 | 12,625 | 12,658 | 12,625 |
| Observations | 212,480 | 210,830 | 212,480 | 210,830 |
